This is one of the most mind-boggling experiments you can do with the quED and its add-ons. It was first published by J.D. Franson in 1989.
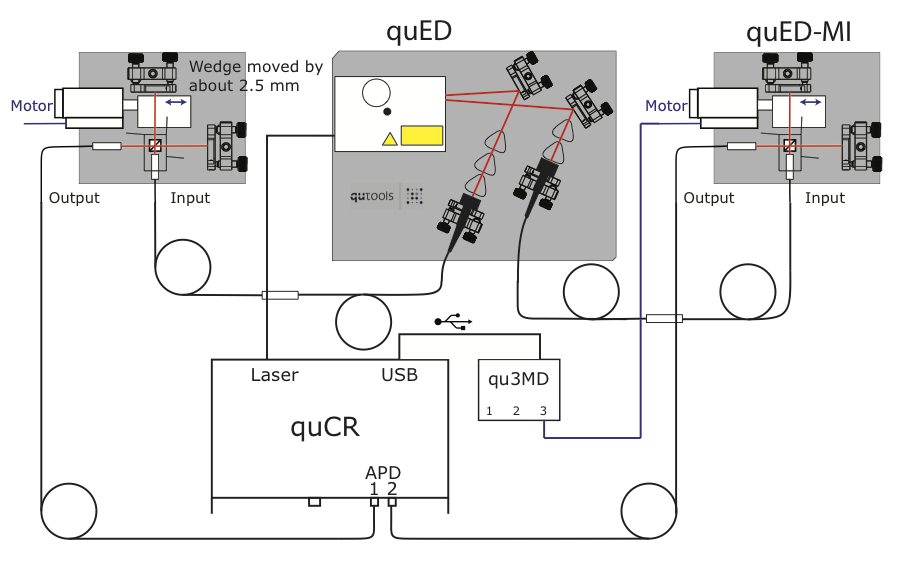
At first we set up the two quED-MI, one in each arm of the quED (the wave plate in the pump beam can be removed, no polarisation entanglement is needed):
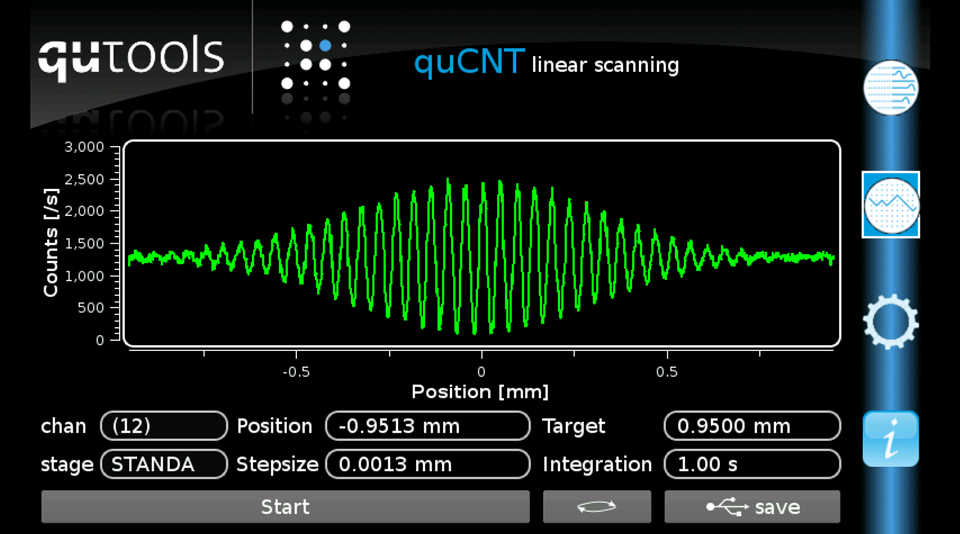
Changing the optical path length in each arm will show the “standard” Single Photon Interference effect:

Now we change the optical path length difference in one of the interferometers (outside of the coherence length, i.e. the envelope of the above measurement) and scan the other one. This is what we see (coincidences are shown):
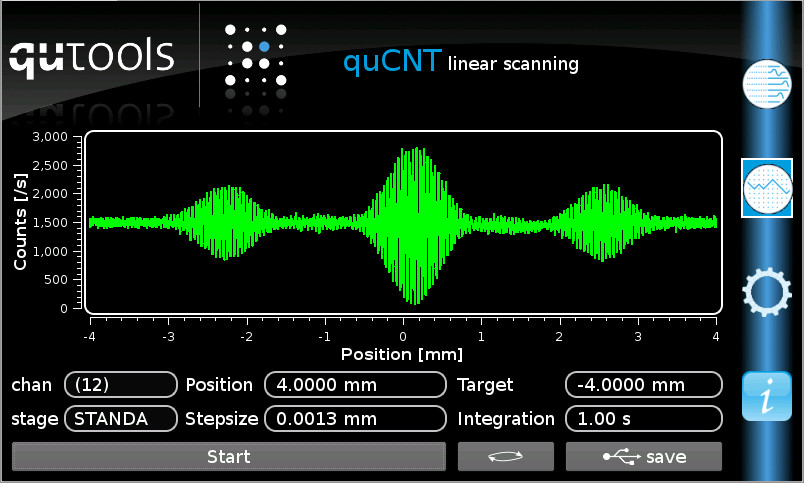
So, besides the known central interference pattern, we see two more, symmetrically distributed around it. The corresponding path length difference is the same as the one in the static interferometer.
Now, we take the same measurement and look at the singles, too:
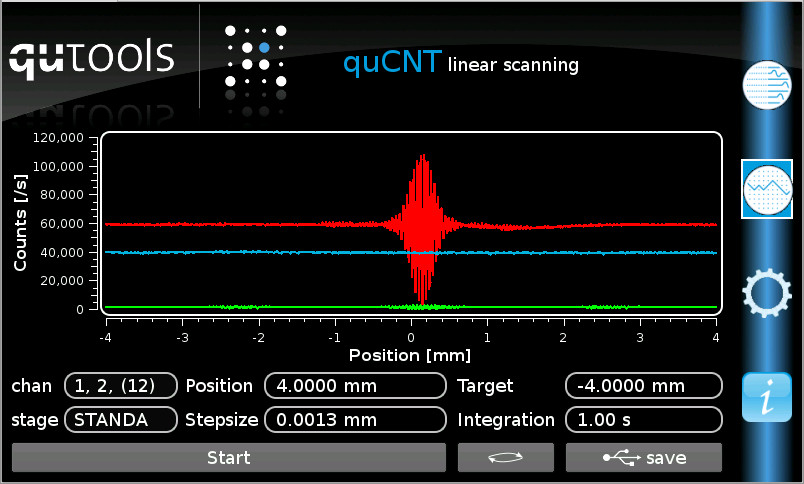
The interference pattern in the singles (the one belonging to the arm in which the interferometer is scanned) only appears around zero path length difference. This is not so astonishing, for the singles it does not matter what happens in the other arm. But, as seen above (and if you look closely, you can see the wriggle on the green curve in the screen shot with the singles, too), the coincidences are modulated in three distinct areas.
What does that mean? Is this another kind of entanglement (remember we did not use polarisation entangled photons)? Is there even a Bell inequality to show that?
What do you need?
- 1 x quED (high rate version advised)
- 2 x quED-MI (for optimal resolution, motorised version advised)
Connected Experiments
- Single Photon Interference
- Quantum Eraser
- Wave-Particle Dualism: Michelson + HBT
- Bell’s Inequality with Polarisation Entanglement
- 2-Photon Interference (Hong, Ou, Mandel)